Nifty Elliott Wave analysis: is Wave 3 done? What Wave 4 and Wave 5 usually look like
Nifty 50 rose five days in a row to a two-month high. How an Elliott Wave count reads the rally, what Wave 4 usually does, and why RSI says overbought.
In this article
Nifty 50 is on its longest winning run in months, and chart watchers are asking the same question: is this a clean Elliott Wave impulse, and has Wave 3 already peaked? The index closed at 23,960.60 on Tuesday, 4 November 2026, up 149.75 points (0.63%) for a fifth straight gain and its best close in two months, according to Business Standard, Upstox and Kotak Neo. On Wednesday morning it jumped about 1.6% more, to around 24,340, as crude oil fell sharply and foreign investors kept buying (Zee Business, Outlook Money, HDFC Sky). Over five sessions the index has gained roughly 5%.
This post explains how an Elliott Wave count reads that move, what Wave 4 and Wave 5 usually look like, and why the RSI is flashing "overbought". It is education, not a trade plan.
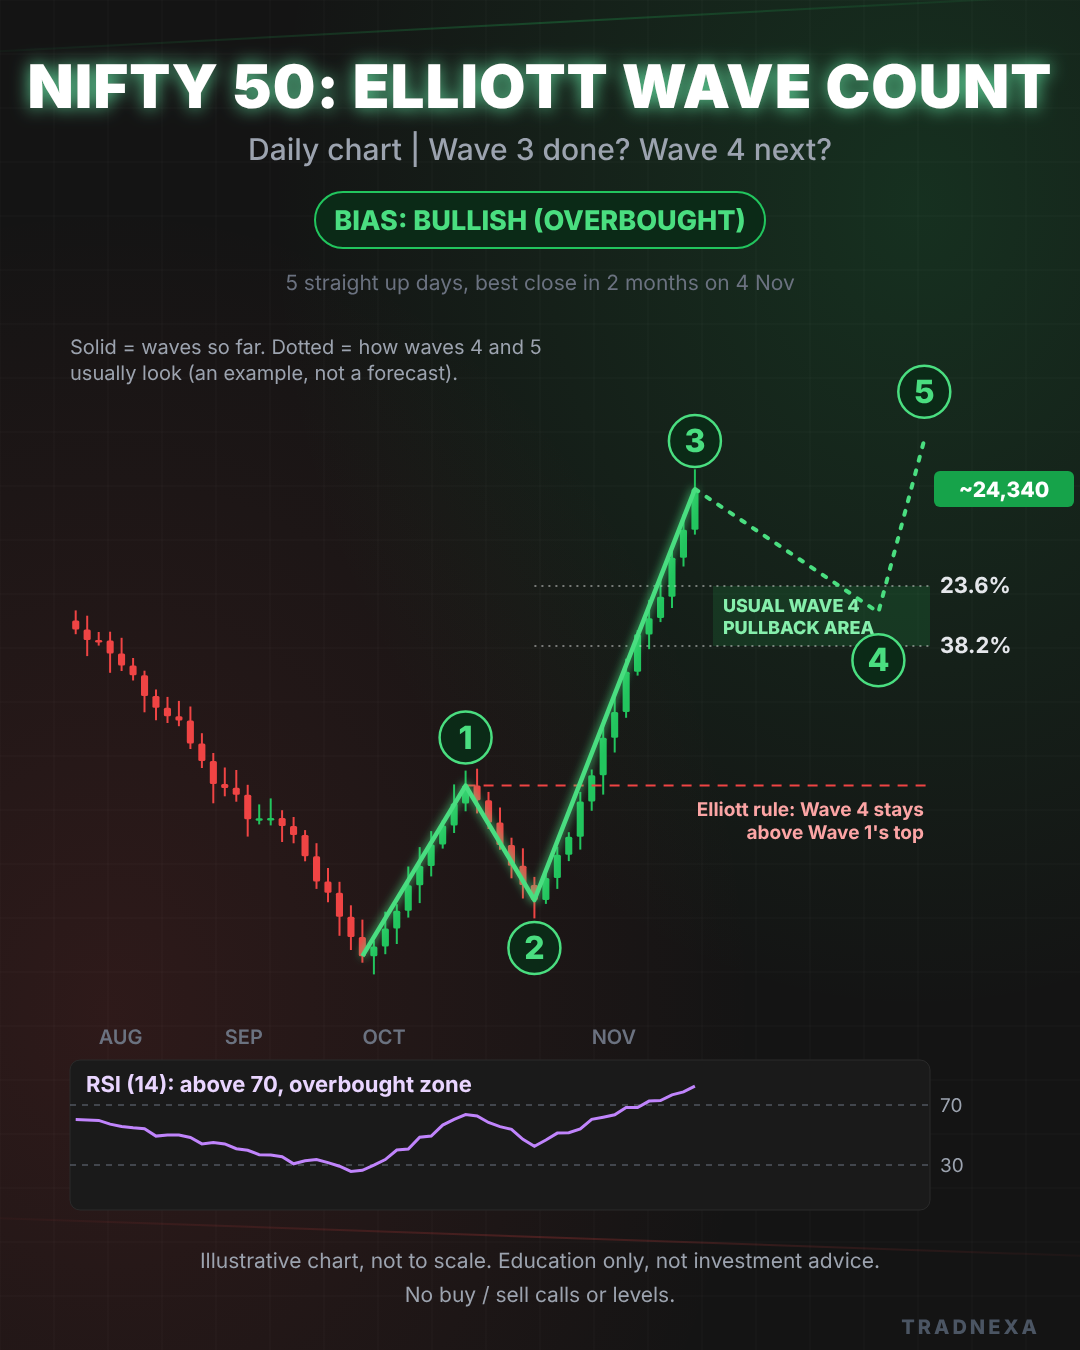
Illustrative chart, not to scale. The dotted part shows how waves 4 and 5 usually look in textbook examples, not a forecast for Nifty.
What is Elliott Wave theory?
Elliott Wave theory says that markets move in repeating patterns driven by crowd mood. In a trend, the main move comes in five waves:
- Waves 1, 3 and 5 move with the trend (up, in an uptrend).
- Waves 2 and 4 are pullbacks against the trend.
After the five waves, a three-wave correction (usually called A, B, C) normally follows.
Three rules decide whether a count is valid at all:
- Wave 2 never falls below the start of Wave 1.
- Wave 3 is never the shortest of waves 1, 3 and 5. It is often the longest and the steepest.
- Wave 4 does not drop into Wave 1's price range, meaning it stays above the top of Wave 1.
If any rule breaks, the count is wrong and analysts look for a different pattern.
How the Nifty rally reads as waves 1, 2 and 3
On the daily chart, many analysts read the move from the October low like this:
- Wave 1: a first rally up from the October bottom, the moment sellers ran out of steam.
- Wave 2: a pullback that stayed above the October low, so rule 1 holds.
- Wave 3: the strong, steep run of the last few sessions, helped by better quarterly earnings, foreign buying and the fall in crude oil, with five green days in a row and a two-month closing high.
That shape, a sharp third leg after a shallower first one, is exactly what a textbook impulse looks like. That's why the "Wave 3" label is so popular right now. But Wave 3 does not end on a schedule: strong third waves often stretch further than expected before they pause.
What Wave 4 usually looks like
Wave 4 is the "breather" after Wave 3. In textbook examples it tends to be:
- Shallow: it often gives back only 23.6% to 38.2% of Wave 3 (two common Fibonacci retracement ratios).
- Sideways and slow: it often moves in a range rather than a sharp drop. Traders call this alternation: if Wave 2 was sharp, Wave 4 is often flat, and the other way round.
- Above Wave 1's top: that is rule 3. If prices fall back into Wave 1's range, the five-wave count is in doubt.
How a Fibonacci retracement works (illustrative numbers)
Say a Wave 3 runs from 1,000 to 1,500 (made-up numbers, not Nifty). The move is 500 points.
| Retracement | Points given back | Price |
|---|---|---|
| 23.6% | 118 | 1,382 |
| 38.2% | 191 | 1,309 |
Analysts watch the area between those two prices to see whether a pullback slows down there. It is a guideline, not a rule: Wave 4 can be smaller, bigger, or take a different shape.
What Wave 5 usually looks like
Wave 5 is the last push in the direction of the trend. It often:
- Makes a new high above Wave 3, sometimes only slightly.
- Has less momentum: the price makes a higher high while the RSI makes a lower high. This is called bearish divergence and is a common sign that the five-wave move is getting tired.
- Is often similar in size to Wave 1, another loose guideline, not a rule.
After Wave 5, a larger correction usually follows, which is why traders pay so much attention to the count in the first place.
Why RSI says "overbought"
RSI (Relative Strength Index) measures how strong recent gains are compared with recent losses, on a scale from 0 to 100. Above 70 is called overbought; below 30 is oversold.
After five straight up days and a roughly 5% rally, the daily RSI on Nifty sits in the overbought zone. That does not mean the market must fall. Strong trends can stay overbought for days. It means the move is stretched, so a pause or pullback (a possible Wave 4) would be normal rather than surprising.
The other way to read it
Elliott Wave counts are opinions, and the same chart can be counted in more than one way:
- Wave 3 may still be running. Strong third waves can extend well beyond what looks "enough".
- The rally may be a correction, not a new trend. If Nifty later falls back into the area of the first rally from the October low (Wave 1's range), the move would look more like an A-B-C bounce inside a bigger downtrend than a fresh five-wave rise.
That is why traders treat the count as a map that gets redrawn as new candles arrive.
Bias: bullish, but stretched
Putting it together, the bias is bullish:
- higher highs and higher lows since the October low;
- five up days in a row;
- a two-month closing high.
The RSI says the move is overbought in the short term, so a pause would fit the usual Elliott pattern.
How to follow it on Tradnexa
- Open the Nifty daily chart, add RSI from Indicators and draw your own count with the Fibonacci retracement tool.
- Institutional NexaScan shows the Nifty and Bank Nifty bias and the PCR, which now reads simply Bullish (1.00 or above) or Bearish (below 1.00). Read our guide to Nifty PCR.
- The Magic Line shows whether the daily trend on Nifty is still up, as a Bullish or Bearish bias.
FAQ
What is the current Elliott Wave count for Nifty?
Many analysts read the rally from the October low as waves 1, 2 and 3 of a five-wave move up, with Wave 3 being the strong run that took Nifty to a two-month closing high of 23,960.60 on 4 November and above 24,300 on 5 November. Counts differ, and they change as new candles form.
What happens after Wave 3 in Elliott Wave theory?
Usually a Wave 4 pullback, often shallow and sideways, which in textbook examples gives back about 23.6% to 38.2% of Wave 3. Then a final Wave 5 push to a new high, often with weaker momentum than Wave 3.
What are the three rules of Elliott Wave?
Wave 2 never falls below the start of Wave 1, Wave 3 is never the shortest of the three trend waves, and Wave 4 does not drop into Wave 1's price range. If one of them breaks, the count has to be redone.
Is Nifty overbought now?
After five straight up days and a gain of about 5%, the daily RSI is in the overbought zone above 70. That shows a stretched move, not a fall that must come: strong trends can stay overbought for a while.
Is Elliott Wave reliable for trading Nifty?
It is a way to describe market structure, not a prediction machine. The rules are strict, but the guidelines (like Fibonacci ratios) are loose, and different analysts often count the same chart differently. Use it alongside trend, momentum and risk management, never on its own.
Sources
- Business Standard: Stock Market Close: Sensex rises for 5th day, gains 384 pts; Nifty at 23,961; IT only sectoral loser (4 Nov 2026)
- Upstox: Market wrap, Nov 4: SENSEX rises 383 pts, NIFTY50 ends at 23,960 (4 Nov 2026)
- Kotak Neo: Closing Bell, 4 November 2026: Sensex, Nifty 50 hold gains at close after subdued trading session
- Outlook Money: Nifty rallies 5% in five sessions: 5 key factors driving gains
- Zee Business: Stock Market Today: Sensex jumps over 1,250 points, Nifty reclaims 24,300 (5 Nov 2026)
- Outlook Money: Stock Market Today: Sensex jumps 1,600 points, Nifty rises 1.7% as crude oil crashes (5 Nov 2026)
- HDFC Sky: Indian markets set for strong open as crude slides, FPIs buy (5 Nov 2026)
For education only. Not investment advice. Tradnexa is not a SEBI-registered investment adviser or research analyst. Trading in crypto, futures and options carries a high risk of loss; past moves don't predict future ones. Read our risk disclaimer.